 TradingRight
Why does price move the way it does?
Inside a Wyckoff trading range, every up-tick and down-tick is anything but random — it is a live contest of supply and demand, evidence of whether effort (volume) and result (price) agree, and the payoff of cause and effect (a base that builds energy → the size of the move). This guide takes the accumulation (bottom) and distribution (top) schematics apart event by event to explain why price moves — and the best buy/sell zone each event implies.
This mirrors the "❓ Why price moves" explainer on the accumulation/distribution panel inside the TradingRight app — where the same principles also auto-detect the stage you are currently in.
The three laws
① Supply & Demand · sets direction
Demand > supply, price rises; supply > demand, price falls. Every bar is a live contest between buyers and sellers.
② Effort vs Result · tests authenticity
Volume is the effort, price movement the result. Agreement = a healthy trend; heavy volume with no progress (divergence) = someone absorbing the other side — a reversal warning.
③ Cause & Effect · sets extent
Time and shares built in the range are the cause; the trend that follows is the effect. The wider and longer the base, the larger the measured move.
Accumulation (bottom): why price finally turns up
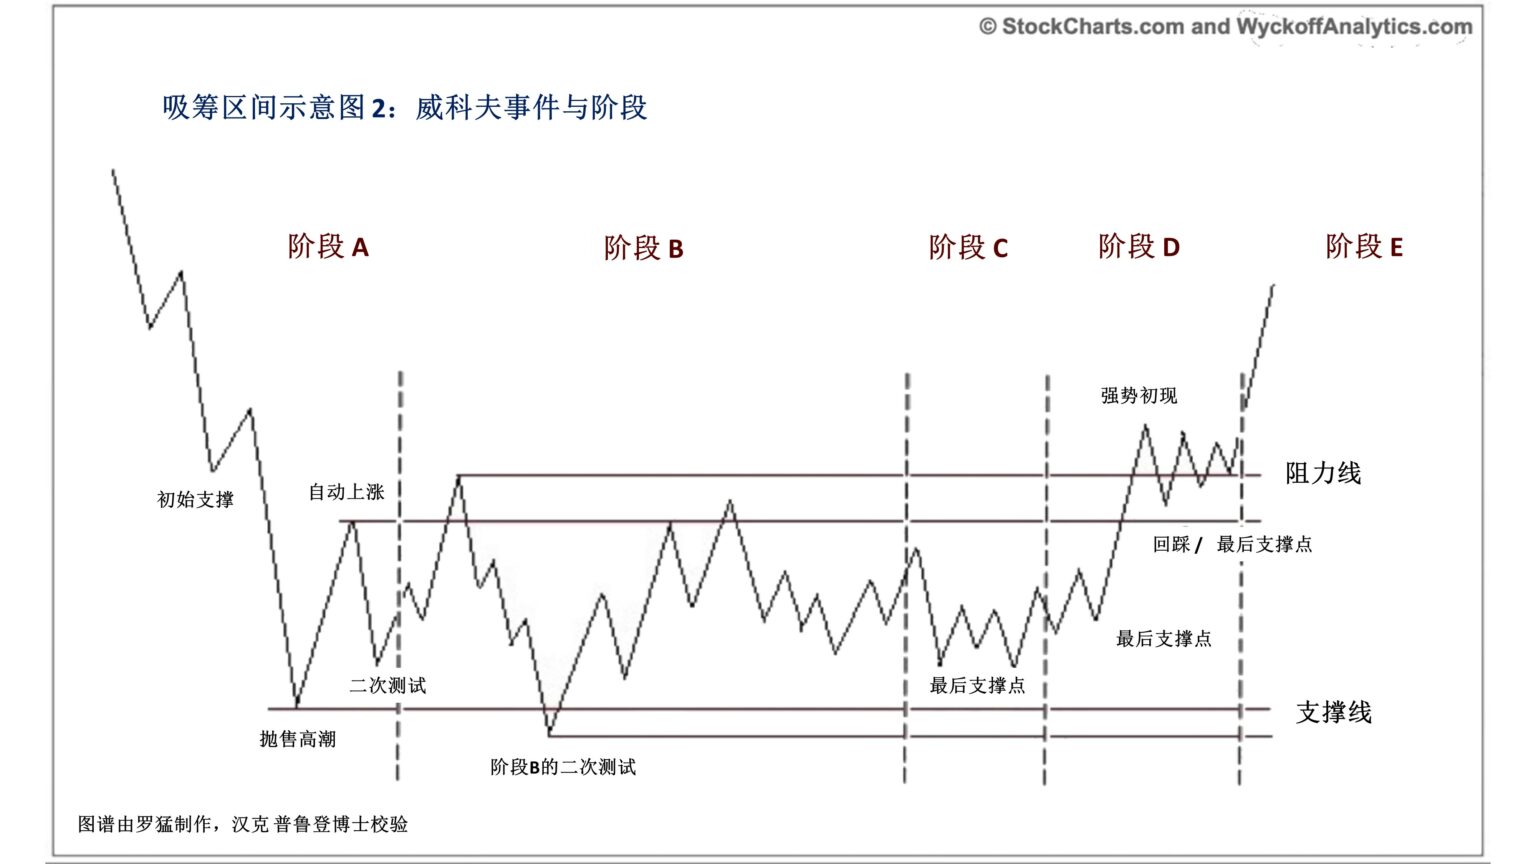
| Event | Supply / Demand | Effort vs Result | Why price moves |
|---|---|---|---|
| PS · Prelim. Support | First real buyers step in to catch the panic — supply still dominates, demand just probing. | Volume rises on the drop yet lower wicks appear: big selling effort, little downward result. | Supply > demand, price still falls — but heavy volume can't make new lows, hinting at buyers below. |
| SC · Selling Climax | The crowd dumps in fear while smart money absorbs — demand concentrates at peak panic. | Huge volume, wide range: selling effort peaks. | A massive transfer moves shares weak→strong hands; supply exhausts, price snaps back. |
| AR · Automatic Rally | A supply vacuum plus short-covering lets demand briefly overpower supply. | Volume expands as price lifts. | With sellers spent, small buying moves price a lot — drawing the top of the range. |
| ST · Secondary Test | Price falls back to retest the low, checking for remaining panic sellers. | Volume shrinks on the retest; the drop narrows. | Low volume down = weak supply; a successful test confirms the floor. |
| ★ Spring | A false break below triggers stops so smart money grabs the last loose shares. | Breaks down on low volume and quickly reclaims: downward effort, no downward result. | Last weak hands shaken out, no supply left below — the fast reclaim is a bear trap, a lowest-risk buy. |
| Test | Probes down again to confirm nobody is left to sell after the Spring. | Volume dries to almost nothing. | No volume = no supply; price refuses to fall, ready to be led by demand. |
| SOS · Sign of Strength | Demand overpowers supply for the first time; a wide rally breaks the range. | Up-move on expanding volume, full bodies: effort and result agree, upward. | Rising price on rising volume proves a real breakout — trend turns sideways→up. |
| ★ LPS | After the breakout, price pulls back but holds above the prior low; demand supports higher. | Pullback on light volume, rallies heavy: selling weak, buying strong. | A higher low = support rising — the confirmed with-trend entry, right before markup. |
| Markup | Demand fully dominates, supply scarce, the crowd chases. | Higher high after higher high; shallow pullbacks, volume expands moderately. | Cause & effect pays out: the longer the base, the bigger the markup — range width is the target. |
Distribution (top): why price finally turns down
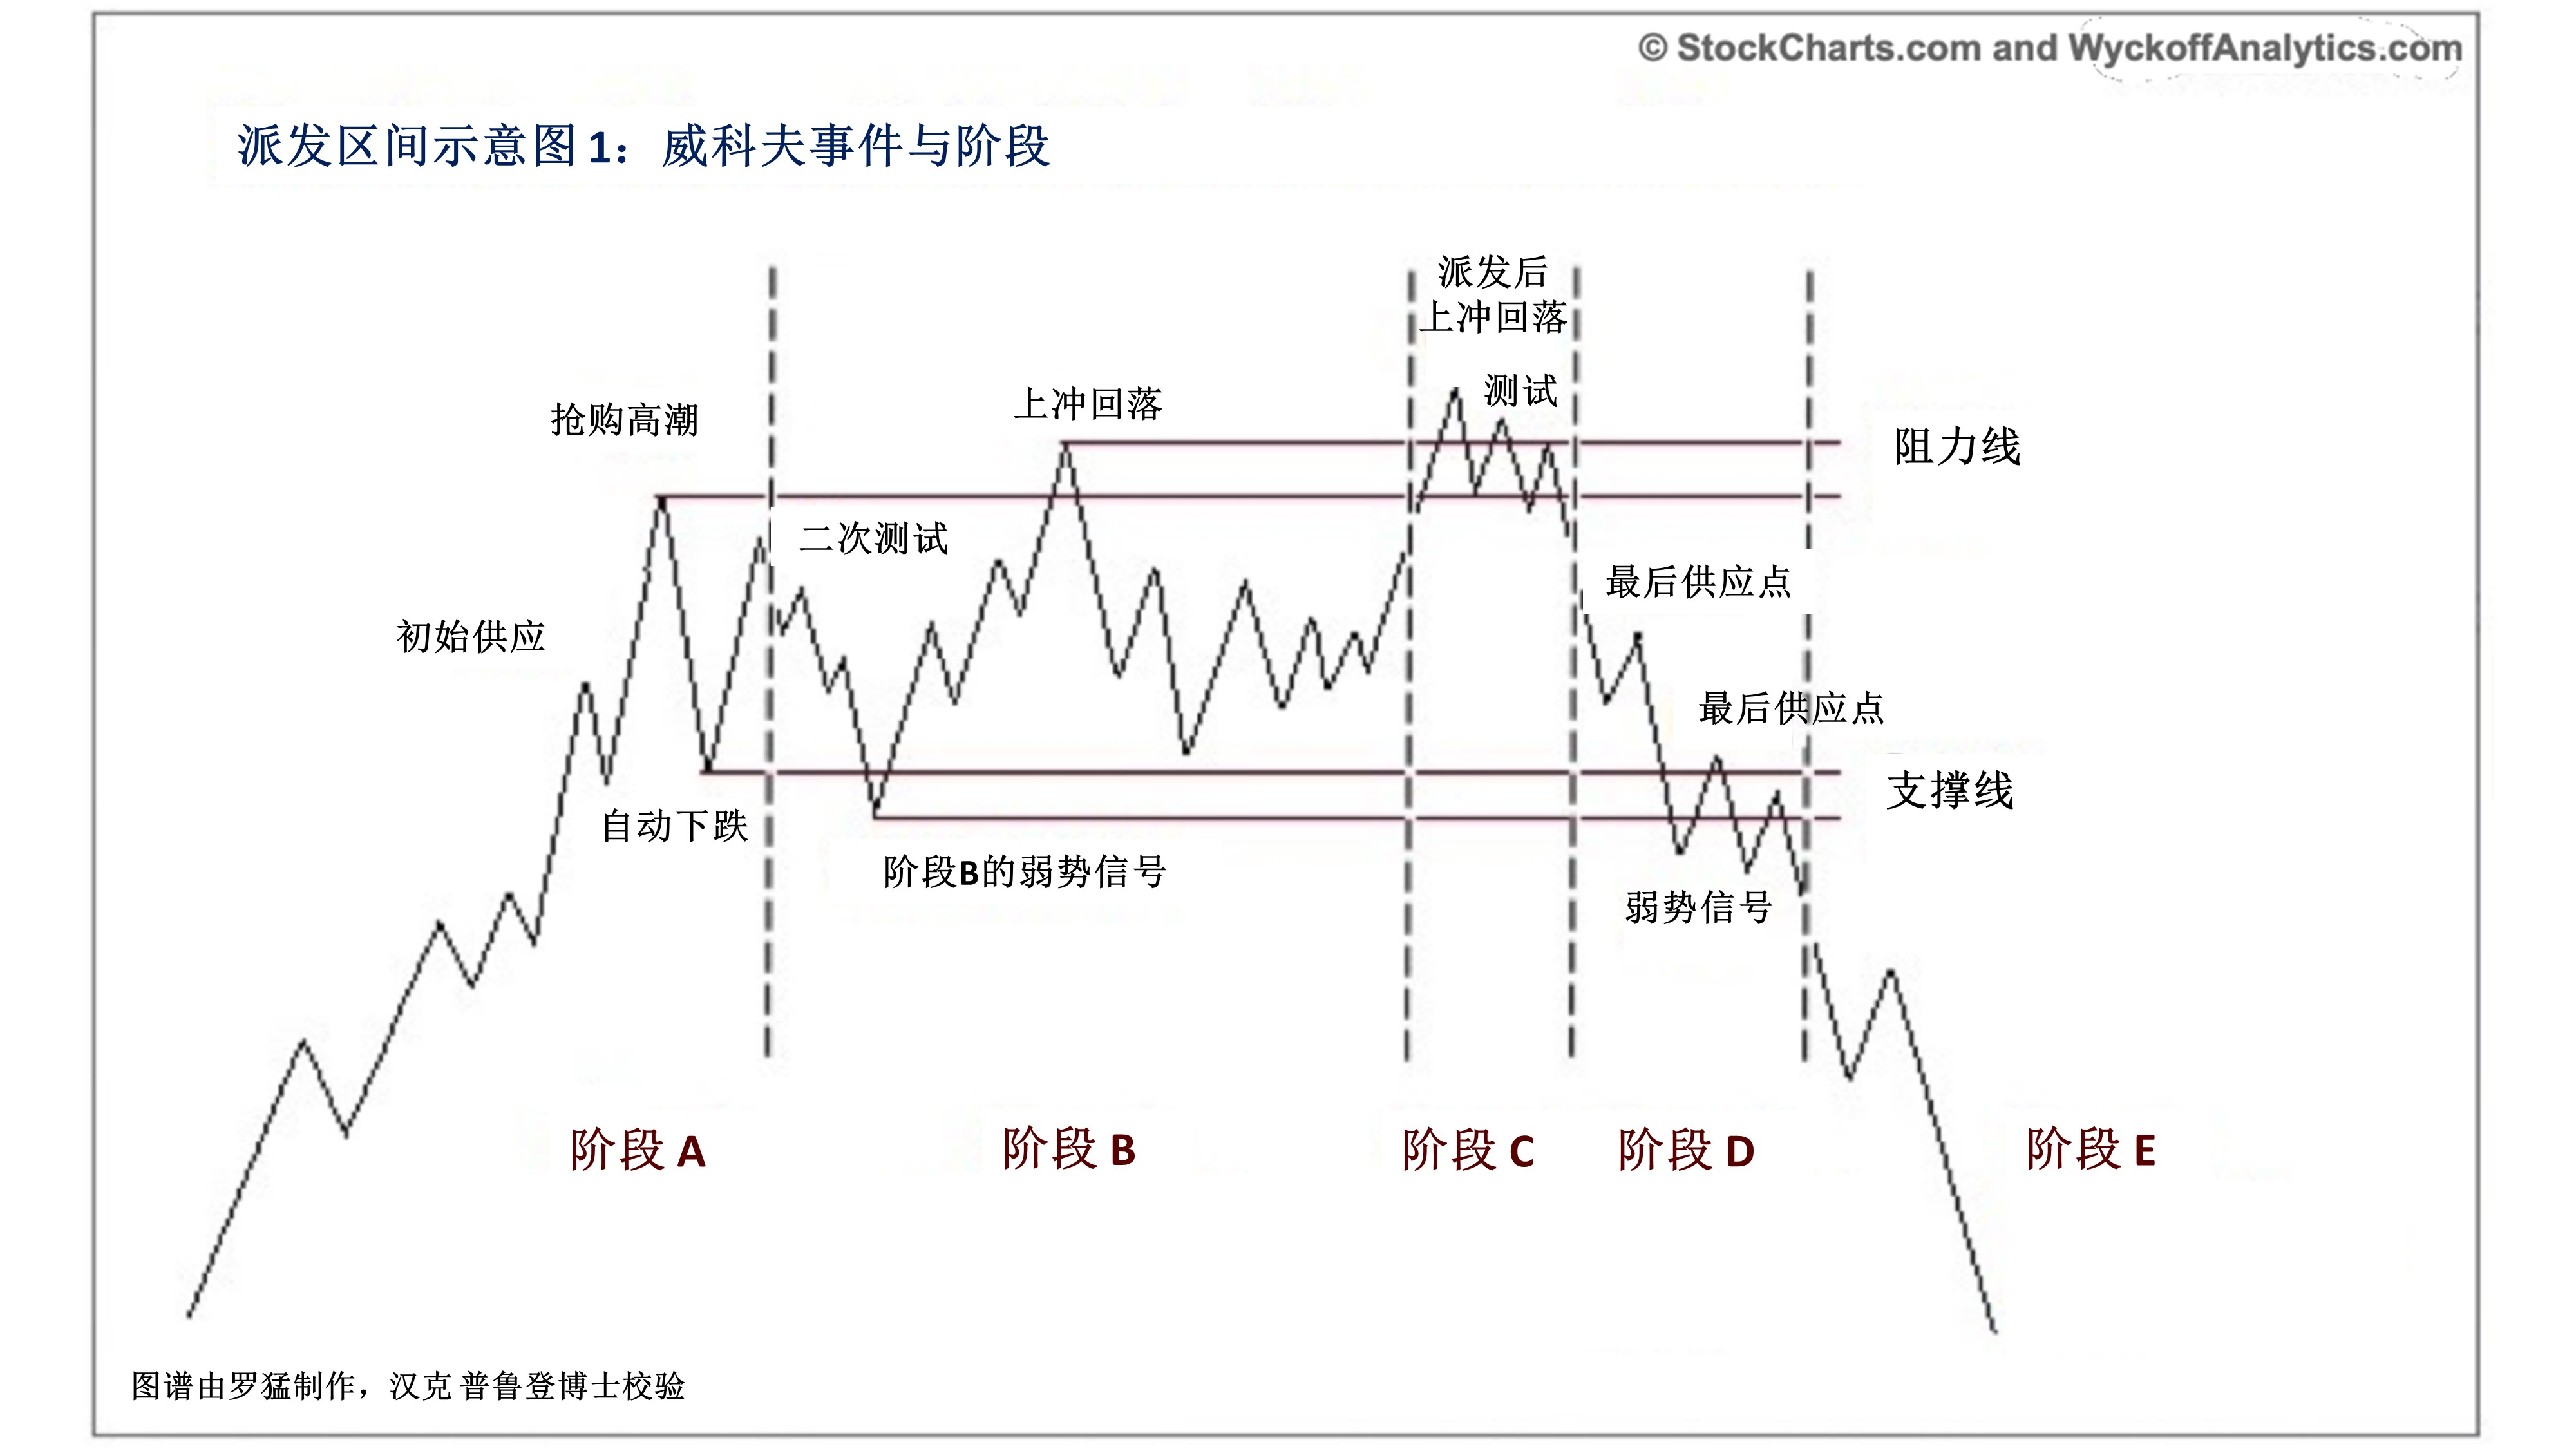
| Event | Supply / Demand | Effort vs Result | Why price moves |
|---|---|---|---|
| PSY · Prelim. Supply | First real sellers appear up high as smart money quietly unloads — demand still strong, supply probing. | First volume surge that stalls with upper wicks: big buying effort, little upward result. | Demand still there, price still high — but heavy volume can't make new highs, hinting at supply above. |
| BC · Buying Climax | The crowd chases in greed while smart money distributes — supply concentrates at peak greed. | Huge volume, wide range: buying effort peaks. | A massive transfer hands shares strong→weak; demand exhausts, price tops and rolls over. |
| AR · Automatic Reaction | A demand vacuum plus profit-taking lets supply briefly overpower demand. | Volume expands as price drops. | With buyers spent, small selling moves price down a lot — drawing the bottom of the range. |
| ST · Secondary Test | Price rises to retest the high, checking for remaining chase-buyers. | Volume shrinks on the bounce; the rally narrows. | Low volume up = weak demand; a failed test confirms the ceiling. |
| UT · Upthrust | A false break above lures buyers so smart money offloads to the chasers. | Breaks up on low volume and falls right back: upward effort, no upward result. | A bull trap — trapped chase-buyers become fresh supply, price drops back inside. |
| ★ UTAD | One last push up to lure buyers while smart money clears remaining inventory. | New high on price/volume divergence, then a fast reversal. | Last buyers trapped at the top; supply overwhelms demand — the fast reversal is a lowest-risk short. |
| SOW · Sign of Weakness | Supply overpowers demand for the first time; a wide drop breaks the range. | Down-move on expanding volume, full bodies: effort and result agree, downward. | Falling price on rising volume proves a real breakdown — trend turns sideways→down. |
| ★ LPSY | After the breakdown, bounces fail; supply caps price lower. | Bounces on light volume, drops heavy: buying weak, selling strong. | A lower high = resistance falling — the confirmed with-trend short, right before markdown. |
| Markdown | Supply fully dominates, demand scarce, the trapped crowd capitulates. | Lower low after lower low; shallow bounces, volume expands moderately. | Cause & effect pays out: the longer the top, the bigger the markdown — range width is the target. |
Let the app auto-detect your stage
TradingRight estimates the current Wyckoff stage, event and entry/exit zone live on the accumulation/distribution panel, and explains every step with the same "❓ Why price moves" walkthrough.
Launch TradingRight →